Gen Z marketing measurement works when you stop treating views as the result and track what happens after the view: saves, shares, code redemptions, signups and a rise in people searching for your brand. Views show that content was seen. These other signals show that someone cared enough to act or pass it on.
This guide is for brand managers and growth leads who have to report on Gen Z marketing to a boss or a CFO. It sets out which metrics to use for which goal, how to make codes and links do real attribution work, what to do about the things you cannot measure, and a one-page dashboard.
Why views mislead
Views are cheap to collect and easy to compare, which is why they dominate reports. They are also the weakest signal of intent. A reel can collect large numbers because it was funny, because the algorithm pushed it, or because it was short enough to autoplay, with no effect on anyone’s buying.
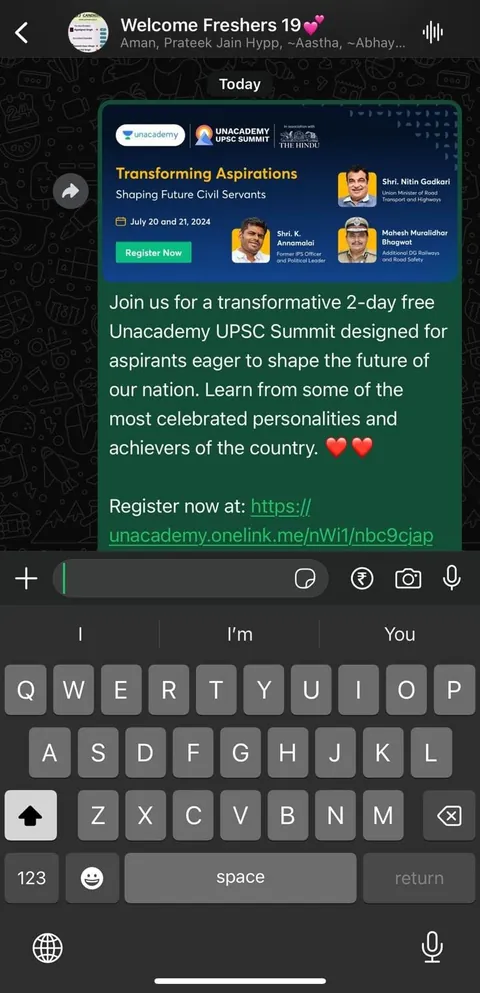
Gen Z behaviour makes this worse. Much of what spreads among students moves through closed channels: WhatsApp class and hostel groups, close-friends lists, direct messages and college meme pages. A share into a hostel group never shows as a public count. The result is that the best-performing content for your goal can look average on a platform dashboard.
So the working rule is simple: choose the metric that matches the job the content was given, and report views only as context. If you are unsure what job each format should have, Gen Z content formats that work lays it out.
Match the metric to the goal
| Goal | Primary metric | Supporting metrics | Weak or misleading |
|---|---|---|---|
| Awareness | Branded search and direct traffic over time | Reach among the target age group, saves, shares, repeat views | Raw view counts, follower growth |
| Consideration | Saves, shares, comments that ask questions | Watch time, profile visits, story replies | Likes alone |
| Trial | Code redemptions, samples taken, first app opens | Cost per trial, redemption by college or creator | Link clicks without follow-through |
| Conversion | Signups, first orders, installs that activate | Cost per activated user, day 7 activity | Installs that never open the app |
| Advocacy | Referrals, repeat codes, user-made posts | Mentions without being asked | Sentiment scores from sampled comments |
Pick one primary metric per campaign and two supporting ones. A report with fifteen numbers tells your boss nothing.
Saves and shares: the best free signals
Saves and shares are the closest thing to intent that a public platform gives you without a code.
- Saves mean the viewer wants to come back: a recipe, a price, an outfit, a how-to. They are strong for proof content and tutorials.
- Shares mean the viewer put your content in front of a specific person. They are the best sign that something was funny, useful or worth arguing about.
Look at the ratio rather than the count. If shares are a healthy fraction of views, the idea travels, and you can put money behind it. If views are high and shares are near zero, the content was watched but not wanted.
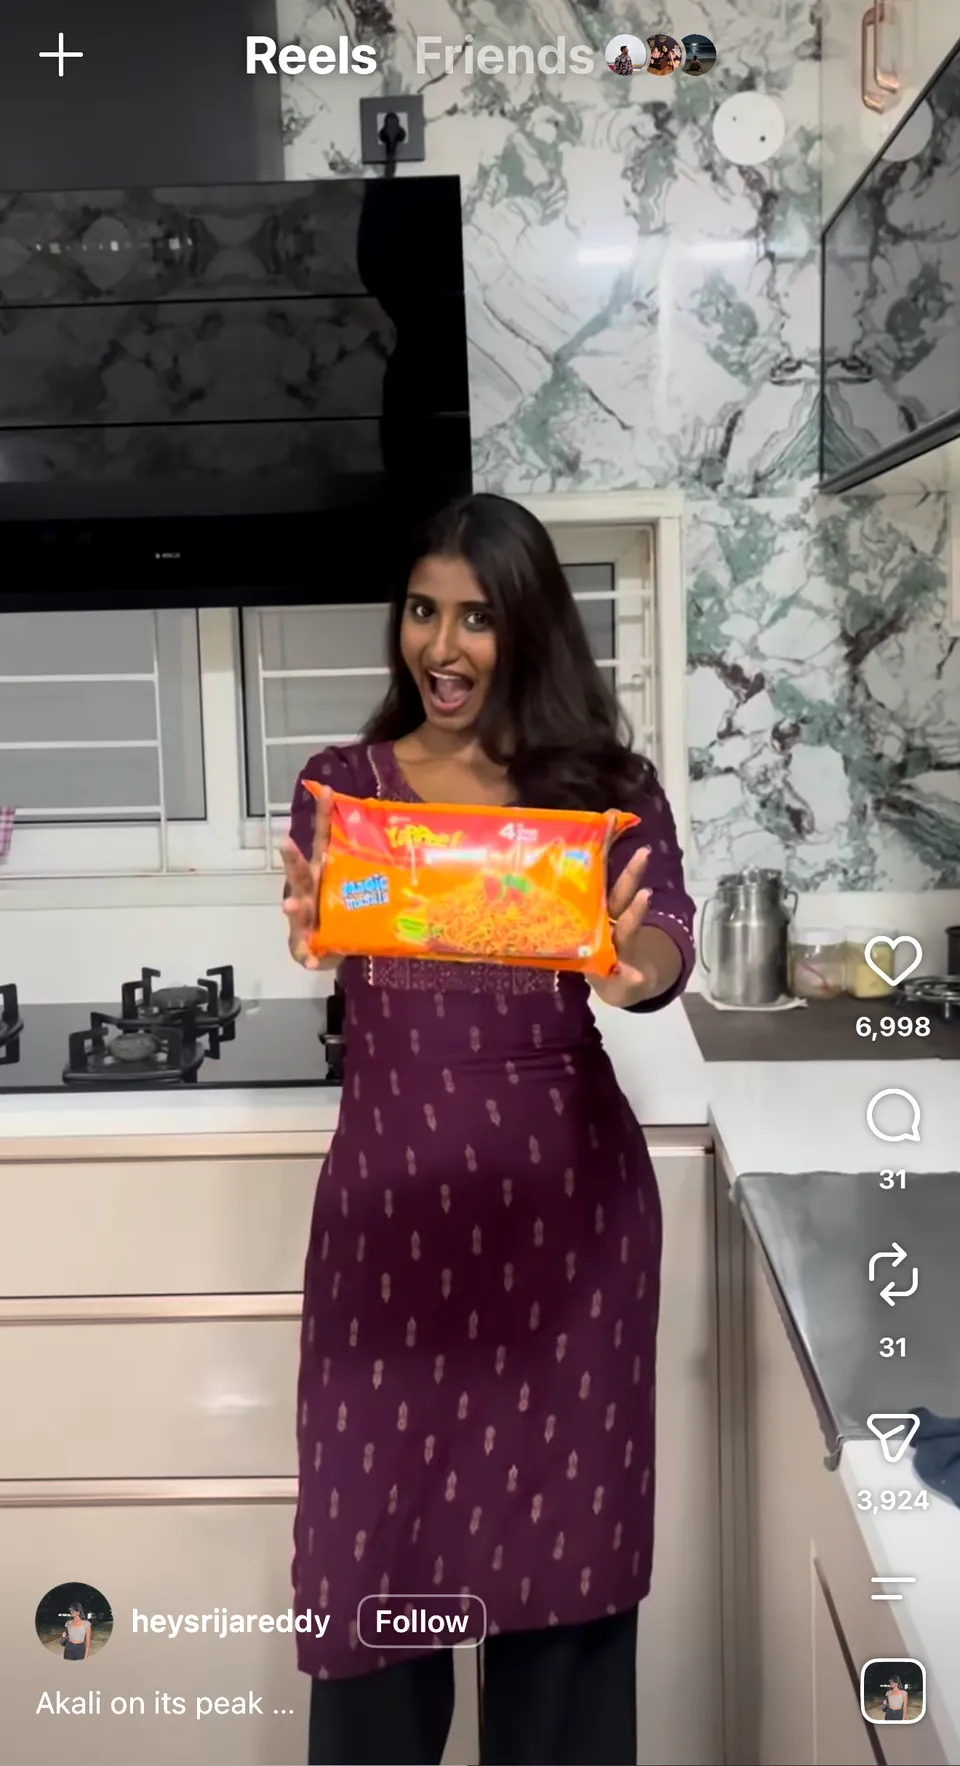
When we ran creators for ITC YiPPee!, the top reel reached 200K+ views with 60K+ likes and 11K+ shares. The shares figure was the one that said the reel was being sent to friends and not merely scrolled past. The ITC YiPPee! case study shows how that campaign was set up.
Codes, links and attribution on campus
For anything that has to show a result in rupees, build tracking into the campaign before launch.
- Unique codes per creator or per college. A code such as a campus-specific string shows which college or creator drove each trial. It is the most reliable attribution in student marketing, because students love a discount and use it.
- Unique links with campaign tags. Each creator or ambassador gets their own link. Do not reuse a single link for the whole campaign.
- A sample form or QR code. For on-ground sampling, a QR code that leads to a short form (name, college, one question) tells you who tried the product and lets you follow up.
- A post-trial question. One question in the signup flow: “How did you hear about us?” with creator, friend, campus stall and other as options. It is imperfect and still useful.
When we ran EatSure’s youth acquisition through ambassadors and creators with the Campus50 referral code, the result was 10K+ app installs, 30K+ unique signups and 40% ROI. A referral code made that countable, since every signup could be traced back to a source. The EatSure case study shows the structure. For app-led goals, our app user acquisition service is built around this kind of attribution.
A caution: codes under-count. Some people see a reel, remember the brand and order later without the code. Treat code redemptions as a floor, not a total.
Signups and activation, not installs
For apps and platforms, an install is not a customer. Measure down the funnel.
| Stage | What to count | Typical failure |
|---|---|---|
| Install | Installs by source | Counting installs from a giveaway as demand |
| Signup | Unique signups by college or creator | Duplicate and fake accounts from referral hunting |
| Activation | First transaction or key action within the first week | A strong signup number and a weak activation number |
| Retention | Users still active after a defined period | Judging the campaign only at launch |
Ask your product team to define “activated” before the campaign starts. The agreed definition prevents arguments about success afterwards.
Search lift: the awareness metric most people skip
If Gen Z marketing is working on awareness, more people will look you up. That shows up in three places.
- Branded search volume in Google Search Console and Google Trends, for your brand name and obvious misspellings.
- Direct and organic social traffic to your site in the weeks after a campaign.
- Instagram and YouTube search, which Gen Z uses as a search engine. Check whether people find your account when they type your brand name.
Compare the weeks before, during and after a burst. Because search lift can trail a campaign by days or weeks, do not judge it on day two. If you run in a few cities, compare those cities against ones where you did nothing, which gives you a rough control group.
A one-page dashboard
Here is a layout you can copy into a sheet. Update it weekly during the campaign and monthly afterwards.
| Block | Metrics | Source | Review cadence |
|---|---|---|---|
| Reach and attention | Views, reach, watch time, saves, shares | Platform insights, creator screenshots | Weekly |
| Intent | Branded search, direct traffic, profile visits, story replies | Search Console, analytics, platform insights | Weekly |
| Action | Code redemptions, samples taken, clicks to landing page | Codes, QR forms, link tracking | Weekly |
| Outcome | Signups, first orders, activated users, cost per activated user | Product analytics, finance | Fortnightly |
| Quality | Which colleges, cities and creators performed; refund or return rate | Code data, ops | Fortnightly |
Add a short “what we will change next week” line at the top. A dashboard that does not change decisions is decoration.
What you cannot measure, and how to handle it
Some real effects will never show up. A student who sees a stall, hears from a friend and orders three weeks later will not carry a code. A meme shared in a closed hostel group leaves no trace.
Do not pretend otherwise. Report measured results as measured, state what is likely under-counted, and use controlled comparisons where you can: a city or college set with the programme against a similar set without it. Where budget allows, run a short post-campaign survey on a sample of the audience asking if they recall the brand. Be honest about sample size in the report.
Fintech and other regulated categories should add one more line to the dashboard: whether every post carried the required disclosure and passed compliance. See Gen Z marketing for fintech for why that matters.
Setting targets before you start
Agree three things in writing before launch: the primary metric, the minimum result that counts as a pass and the date on which you will judge it. Without these, every result looks like a success. Our cost bands start from ₹2 lakh for a single-city pilot or a creator-only campaign, and a pilot is a good place to learn what your own baseline looks like before you scale to a multi-city programme. To plan this with us, get in touch, and see how our Gen Z marketing agency approaches reporting.
Questions people ask
How do you measure the success of Gen Z marketing?
Match the metric to the goal. For awareness, use branded search and direct traffic. For consideration, use saves, shares and meaningful comments. For trial and conversion, use code redemptions, signups and activated users. Views are context, not the result. Agree the primary metric before the campaign starts.
What metrics matter most for Gen Z campaigns?
Saves and shares for content quality, code redemptions for trial, activated users for apps and branded search for awareness. The right primary metric depends on what the campaign was meant to do. Choose one primary and two supporting metrics so the report stays readable.
Why are views a poor measure of Gen Z engagement?
Views measure exposure, not intent. Content can get many views because the platform pushed it, with no effect on buying. Much Gen Z sharing also happens in private groups that platforms do not count, so the most effective content can look average on a dashboard.
How do you track campus marketing results?
Use unique codes per college or creator, tagged links, QR codes for sampling and a “how did you hear about us” question at signup. Treat the numbers as a floor, because some people act later without using the code. Compare activity in campaign colleges against similar colleges with no activity.
What is search lift and why does it matter?
Search lift is the rise in people searching for your brand after a campaign. It matters because Gen Z often searches on Google, Instagram and YouTube after seeing something interesting. Track branded search in Google Search Console and compare the weeks before, during and after the campaign.
How long should we wait before judging a Gen Z campaign?
Judge activity metrics weekly, but give awareness and search lift several weeks after the campaign ends. Set the judgement date in advance. College calendars matter too: results in exam weeks or semester breaks will not match results in fest season or the weeks after admissions.